
|

|

| |||
| teem | / | nrrd | / | demo |
Basic 3D volume inspection with unu |
Thus, Windows/Cygwin users should make this alias:
and everyone else should make this alias:alias XV "unu quantize -b 8 | unu save -f png | pv -"
The "XV" alias will be used repeatedly below.alias XV "unu quantize -b 8 | unu save -f pnm | xv -"
The examples below will use the vfrhand.nhdr dataset created in another nrrd demonstration page.
For integral data values (as result from most scans), its best for each bin in the histogram to have the same number of values mapping to it, or to have exactly one value mapping to each bin. Currently, "unu histo" doesn't have an easy way of doing this automatically, so you first have to learn the value range by using "unu minmax":
Which returns:unu minmax vfrhand.nhdr
That means if we make a histogram with 878 bins, we have a nearly perfect mapping of three values per bin (878 * 3 == 2634 == one more than # unique values). We can constrain the range of values that are histogrammed with the "-min" and "-max" options of "unu histo", but it will probably suffice to use its default behavior of histogramming the exact full range of values it sees in the input nrrd. Once we have formed the histogram, it can be displayed with "unu dhisto", which has to be told (via "-h") how high to make the image:min: 0.000000 max: 2632.000000
unu histo -i vfrhand.nhdr -b 878 | unu dhisto -h 600 | XV
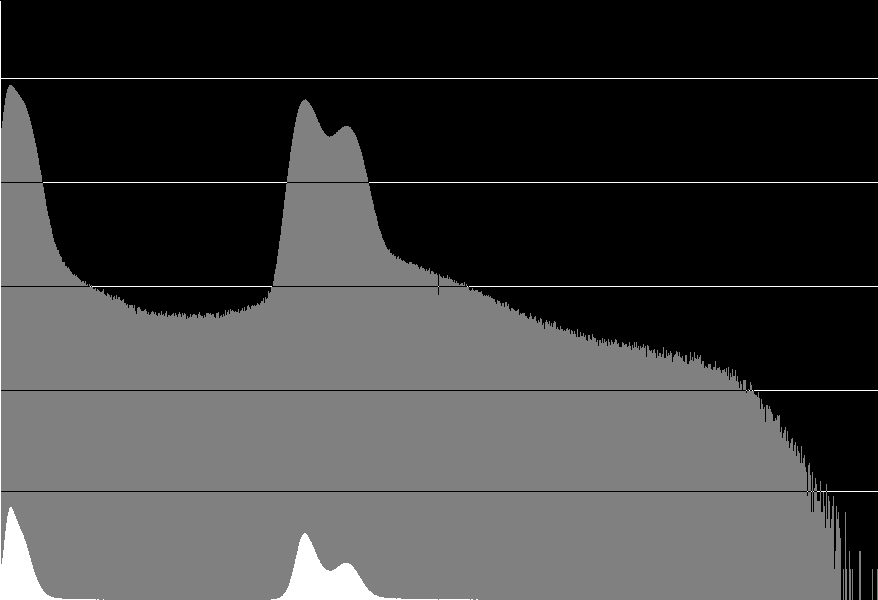
The bin counts in the histogram are linearly scaled and plotted in the white part of the image. The gray plot shows a base-10 logarithm of the histogram, which is very useful for seeing variations in small bin counts. The horizontal lines are the powers of 10 for the logarithm-scaled histogram: the first line marks 10 hits, second line marks 100 hits, and so on.
This particular histogram has two clear peaks, the low one for the background value, and the middle one for soft tissue. Notice that there isn't really a peak for bone- its values are spread over a wide range of high values.
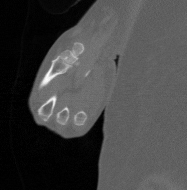
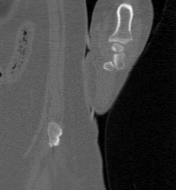
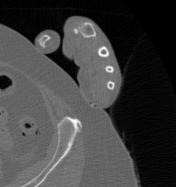
unu slice -i vfrhand.nhdr -a 0 -p 100 | XV
unu slice -i vfrhand.nhdr -a 1 -p 100 | XV
unu slice -i vfrhand.nhdr -a 2 -p 100 | XV
| 
| 
|
| "-a 0" | "-a 1" | "-a 2" |
If you want to save the image out to disk instead of displaying it, you might say something like:
The pre-built versions of unu know how to read and write PNG images. Because it has lossless compression of gray scale and color images, as well representing images with 8-bit or 16-bit channels, and because it is supported in nearly every browser and office application, PNG is the only format anyone should ever think about using. No kidding.unu slice -i vfrhand.nhdr -a 2 -p 100 | unu quantize -b 8 -o z100.png
unu project -i vfrhand.nhdr -a 1 -m max | XV
unu project -i vfrhand.nhdr -a 1 -m sum | XV
unu project -i vfrhand.nhdr -a 1 -m var | XV
| 
| 
|
| "-m max" | "-m sum" | "-m var" |
Notice that the variance image has the useful effect of clarifying where there are large changes in the value, and this helps delimit features of interest, like the hand. In this kind of CT dataset, the more "interesting" things tend to be at higher data values, so doing a max projection helps show them. There are some kinds of datasets where the interesting values are lower, so the analogous measure would be min (with "-m min") instead of max.
NOTE: As currently implemented, "unu project" is pretty stupid about how it traverses memory. Thus "unu project -a 0" will run faster than will "unu project -a 1", which will run faster than "unu project -a 2". This will probably be fixed in later version of nrrd.
In projection images (and often in slice images) the contrast can be improved to show more image detail. One method of automatic contrast adjustment is histogram equalization, which is available as "unu heq". This needs to know how many bins to put in the histogram (via the "-b" option), and how much of the equalization to apply (via the "-a"). The examples below demonstrate usefully reliable values for both of these:
unu project -i vfrhand.nhdr -a 1 -m max | unu heq -b 3000 -a 0.8 | XV
unu project -i vfrhand.nhdr -a 1 -m sum | unu heq -b 3000 -a 0.8 | XV
unu project -i vfrhand.nhdr -a 1 -m var | unu heq -b 3000 -a 0.8 | XV
| 
| 
|
| "-m max" | "-m sum" | "-m var" |
If you want to better see small variations in the values in a projection, you can use a colormap. Nrrd knows how to read unadorned text files, so a file like darkhue.txt is the simplest way to store a colormap. When the colormap control points are regularly spaced (and hence not explicitly represented), the command to do the colormapping is "unu rmap". The result of the mapping will have the same type as the colormap itself, and because plain text files are always read in as floating point values, the result has to be quantized again before display (but "XV" does that for us):
unu project -i vfrhand.nhdr -a 1 -m max \
 | unu heq -b 3000 -a 0.8 | unu rmap -m darkhue.txt | XV
unu project -i vfrhand.nhdr -a 1 -m sum \
 | unu heq -b 3000 -a 0.8 | unu rmap -m darkhue.txt | XV
unu project -i vfrhand.nhdr -a 1 -m var \
 | unu heq -b 3000 -a 0.8 | unu rmap -m darkhue.txt | XV
| 
| 
|
| "-m max" | "-m sum" | "-m var" |
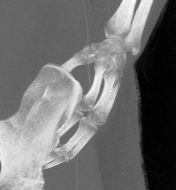
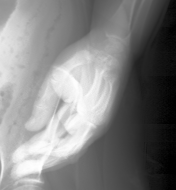
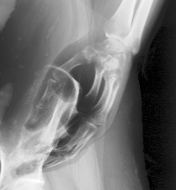
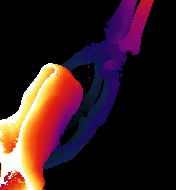
From looking at the histogram above, and knowing the value range, we can guess that an isosurface for the air/soft-tissue boundary is about at value 500, and an isosurface for the soft-tissue boundary is about at value 1200. The first two steps here clamp the values to be no lower than 500, and the subtracts 500 from all the values. The last step ("unu 2op exists") is a trick to deal with the fact that some scanlines had no values greater than 500, so there is no sensible depth value for the isosurface.
unu 2op max 500 vfrhand.nhdr | unu 2op - - 500 \
 | unu project -a 1 -m histo-min | unu 2op exists - 0 | XV
unu 2op max 1300 vfrhand.nhdr | unu 2op - - 1300 \
 | unu project -a 1 -m histo-min | unu 2op exists - 0 | XV
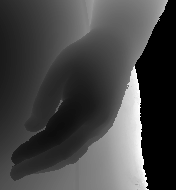
| 
|
| 500 | 1300 |
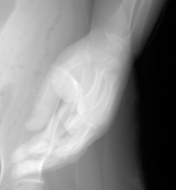
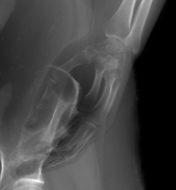
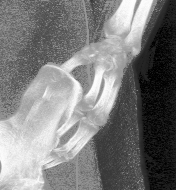
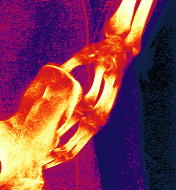
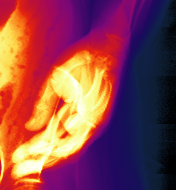
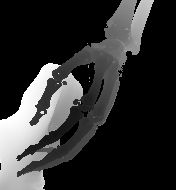
To look at the "far side" of the object, use "-m histo-max". Histogram equalization and colormapping are useful here as well:
alias IMG "unu 2op exists - 0 | unu heq -b 3000 -a 0.8 -s 1 | unu rmap -m darkhue.txt"
unu 2op max 500 vfrhand.nhdr | unu 2op - - 500 \
 | unu project -a 1 -m histo-min | IMG | XV
unu 2op max 1300 vfrhand.nhdr | unu 2op - - 1300 \
 | unu project -a 1 -m histo-min | IMG | XV
unu 2op max 500 vfrhand.nhdr | unu 2op - - 500 \
 | unu project -a 1 -m histo-max | IMG | XV
unu 2op max 1300 vfrhand.nhdr | unu 2op - - 1300 \
 | unu project -a 1 -m histo-max | IMG | XV
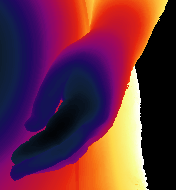
| 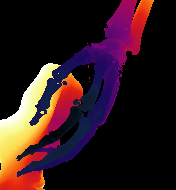
| 
| 
|
| 500, "-m histo-min" | 1300, "-m histo-min" | 500, "-m histo-max" | 1300, "-m histo-max" |
An "IMG" alias was set up for some repetitious steps. Notice the "-s 1" option to "unu heq": this turns on "smart" processing, so that the value warping based on the value histogram is not at all affected by a constant background value, which is necessary for this particular kind of projection.